

Handling Complex Tables, Charts, and Diagrams in Educational Books

Why Visual Accuracy Matters in Educational Publishing

A science student may rely on a chart to understand experimental results. An engineering learner may interpret a technical diagram to solve a design problem. A mathematics textbook may use tables to explain statistical relationships. When these visual elements are poorly formatted, learning becomes more difficult and the risk of misunderstanding increases.

Educational publishers face a unique challenge: presenting large volumes of technical information in a format that remains clear, accurate, and accessible. Complex tables, charts, and diagrams are essential teaching tools, but they also represent some of the most demanding components in textbook production.

Professional publishing workflows help ensure these visual elements support learning rather than create confusion.


Why STEM Educational Content Is Visually Complex

Unlike traditional text-heavy publications, educational books often contain extensive visual content.

Common examples include:

  • Statistical tables
  • Scientific charts
  • Engineering diagrams
  • Biological illustrations
  • Chemical structures
  • Process flowcharts
  • Technical schematics
  • Data visualizations

These elements must work together with surrounding text while maintaining consistency throughout the publication.

The Challenge of Visual Density

A single page may contain:

  • Explanatory text
  • Mathematical formulas
  • Figure references
  • Data tables
  • Supporting diagrams

Without careful layout planning, pages can quickly become overcrowded and difficult to navigate.

Managing Large and Detailed Tables

Tables are widely used in educational publishing because they present complex information in a structured format.

However, large tables create several production challenges.

Common Table Formatting Issues
  • Misaligned columns
  • Inconsistent units
  • Overflowing content
  • Poor spacing
  • Difficult mobile viewing
  • Broken table references

Professional composition ensures that tables remain readable while preserving the integrity of the underlying data.

Best Practices for Educational Tables

Publishers often focus on:

  • Consistent column alignment
  • Clear row hierarchy
  • Logical grouping of information
  • Standardized units
  • Adequate whitespace

These practices improve readability and help students locate information more efficiently.

Creating Effective Charts for Learning

Charts transform raw data into visual insights.

Educational books frequently use:

  • Bar charts
  • Line charts
  • Scatter plots
  • Pie charts
  • Statistical graphs

The goal is not simply to display data but to make patterns easier to understand.

Compare Poor and Effective Chart Design

Poor Chart Design

Effective Chart Design

Excessive visual clutter

Clear presentation

Inconsistent labeling

Standardized labels

Difficult-to-read scales

Logical scale selection

Weak contrast

Strong visual hierarchy

Crowded annotations

Focused explanations

Well-designed charts improve comprehension while reducing cognitive overload.

Handling Technical and Scientific Diagrams

Diagrams are among the most important learning tools in STEM education.

Examples include:

  • Circuit diagrams
  • Mechanical drawings
  • Anatomical illustrations
  • Process diagrams
  • Laboratory workflows

These visuals often contain numerous labels, dimensions, callouts, and references.

Why Diagram Consistency Matters

Students frequently move between:

  • Text explanations
  • Figure references
  • Diagram labels
  • Assessment questions

Consistent formatting helps readers connect these elements quickly and accurately.

Professional production workflows ensure that leader lines, labels, captions, and numbering systems remain uniform throughout the publication

Maintaining Accuracy During Revisions

Educational content evolves through multiple review cycles.

Updates may involve:

  • New data
  • Revised illustrations
  • Updated charts
  • Additional references
  • Curriculum changes

Every revision introduces opportunities for inconsistencies.

Publishers must verify:

  • Figure numbering
  • Table references
  • Caption accuracy
  • Label placement
  • Cross-references

Structured quality-control processes help prevent errors from reaching final publication.

Supporting Multi-Format Educational Publishing

Today’s educational content is delivered through multiple channels.

These include:

  • Printed textbooks
  • eBooks
  • Learning platforms
  • Mobile applications
  • Assessment systems

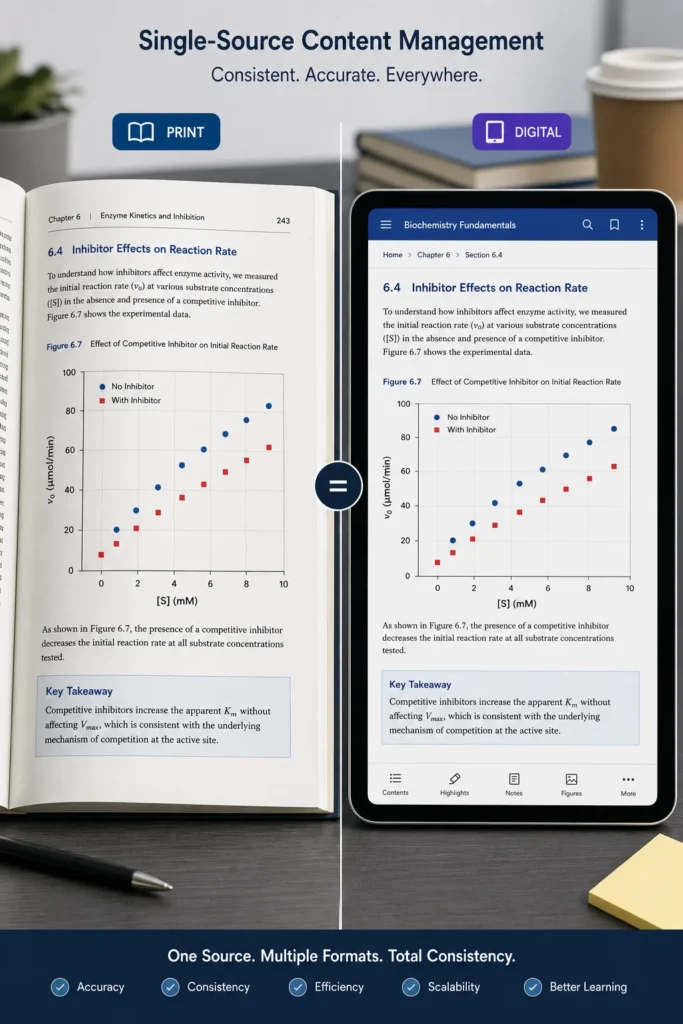
A chart that looks correct in print may not display properly on a smaller screen if publishing workflows are not carefully managed.

Traditional Production vs Structured Publishing

Traditional Production

Structured Publishing

Separate layouts for each format

Single-source content management

Repeated manual updates

Centralized content updates

Higher formatting risk

Greater consistency

Longer revision cycles

Faster publishing workflows

Increased maintenance effort

Improved scalability

The Role of Quality Control in Visual Content

Quality control is particularly important when managing visual educational assets.

Review teams typically verify:

  • Table consistency
  • Chart accuracy
  • Diagram alignment
  • Figure references
  • Symbol accuracy
  • Layout structure
  • Cross-references

These checks help ensure educational materials remain reliable and easy to understand.

A Practical Publishing Scenario

Consider a university-level engineering textbook containing:

  • 350 tables
  • 500 technical diagrams
  • 200 charts
  • Print and digital editions

During peer review, multiple chapters are revised to include new research data and updated illustrations.

Without structured workflows, updating references and maintaining consistency becomes time-consuming and error-prone. A centralized publishing process allows content teams to manage revisions efficiently while preserving accuracy across every format.

Delivering Clear and Reliable Visual Learning Resources

Tables, charts, and diagrams play a critical role in educational publishing. They help transform complex concepts into understandable information, making them essential components of effective STEM learning materials.

Publishers that invest in structured composition, rigorous quality control, and scalable publishing workflows can improve visual consistency, reduce production errors, and create educational resources that support stronger learning outcomes across both print and digital environments.

FAQ

Tables organize complex information into a structured format that helps students compare, analyze, and understand data more effectively.

Publishers must ensure charts remain accurate, readable, properly labeled, and consistent across multiple formats

Consistent diagrams improve comprehension and help students connect visual information with accompanying text and references

They use structured workflows, quality-control reviews, reference validation, and standardized formatting practices.

Structured publishing supports centralized content management, simplifies updates, improves scalability, and helps maintain consistency across print and digital platforms.